What does a quant do in commodities trading?
- model development
- portfolio optimisation
- trading strategies
- pricing of complex products (storage, tolling, swing contracts)
Example: Gas storage
- natural gas can be stored
- used to
- meet load variations
- speculation (buy low, store, sell high)
- subject to physical constraints...
- injection and withdrawal rate depend on time and current amount of gas stored
- minimum and maximum storage capacity can vary with time
- ...find an optimal strategy
In [2]:
import numpy as np
import pandas as pd
from datetime import datetime

start_date = datetime(2015, 7, 1)
end_date = datetime(2016, 7, 1)
dates = pd.date_range(start_date, end_date)

max_inventory = pd.TimeSeries(3640, index=dates)
max_inventory[10:] = 3200
min_inventory = pd.TimeSeries(0, index=dates)
min_inventory[10:] = 200
with_rate = pd.Series([2, 4, 8, 15, 23, 30, 35, 38, 40, 42, 43, 43],
                      index=[0, 1300, 1550, 2000, 2150, 2550, 2800, 3100, 3150, 3200, 3350, 3600])
inj_rate  = pd.Series([27, 26, 25, 24, 23, 22, 21, 20, 17, 11, 10, 5],
                      index=[0, 1300, 1550, 2000, 2150, 2550, 2800, 3100, 3150, 3200, 3350, 3600])
wth_rate_constraints = pd.DataFrame({'min': pd.Series(2, index=dates),
                                     'max': pd.Series(45, index=dates),
                                    })
inj_rate_constraints = pd.DataFrame({'min': pd.Series(2, index=dates),
                                     'max': pd.Series(26, index=dates),
                                    })
In [3]:
storage_params = {'name': 'TestStorage',
                  'start_inventory': 2500,
                  'max_inventory': max_inventory,
                  'min_inventory': min_inventory,
                  'with_rate': with_rate,
                  'inj_rate': inj_rate,
                  'inj_cost': 0,
                  'with_cost': 0,
                  'end_inventory': 2500,
                  'storage_start_date': start_date,
                  'storage_end_date': end_date,
                  'wth_rate_constraints': wth_rate_constraints,
                  'inj_rate_constraints': inj_rate_constraints,
                 }
In [4]:
import btglib.quant.models.storage as sc

storage = sc.Storage(storage_params)
In [5]:
curve = 20*pd.Series(np.sin(np.linspace(0,10,len(dates))/1.5-0.5), index=dates)+40

storage.optimize(curve, curve)
storage.plot();

In [6]:
curve = 20*pd.Series(np.sin(np.linspace(0,10,len(dates))/1.5+1), index=dates)+40

storage.optimize(curve, curve)
storage.plot();

The optimal strategy depends on the gas price curve
...which we don't know...
...so we generate scenarios
In [7]:
from btglib.quant.models.simulator import Simulator

model_parameters = {'distribution': 'LogNormal',
                    'volatility': np.array([0.1]*len(dates))[:,None],
                    'correlation': np.eye(1),
                    'names': ['gas'],
                   }

simulator = Simulator('5-Jun-2015', dates, curve[:,None], model_parameters)
sims = simulator.generate_paths(100)
In [8]:
plt.plot(sims.ix[0,:,:], color='k', alpha=0.1);
plt.plot(curve, color='r', linewidth=2);

Stochastic optimisation problem
- optimal strategy under uncertainty
- Monte-Carlo simulation with different distributions
- large optimisation problems
- price sensitivities
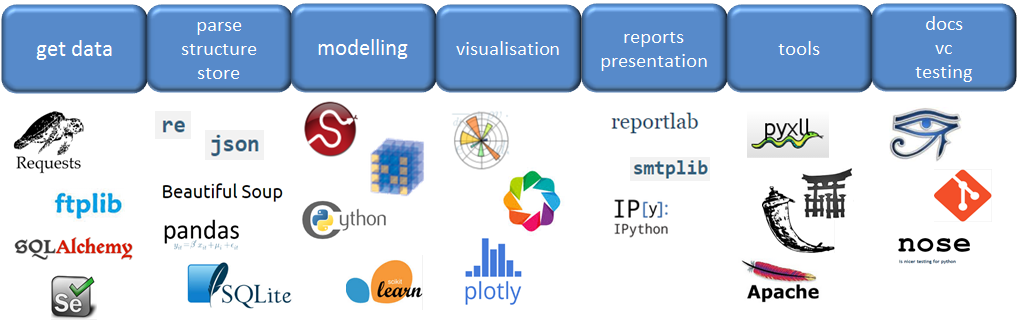
Why Python?
- ideal for start-up
- quick cycle from idea to prototype to tool
- "batteries included" - scientific libraries, visualisation tools, documentation
- python may be slow...but cython (c/c++) is not!
To trade complex products one first needs to be able to...trade!
- Building an ETRM (Energy Trading and Risk Management system)
- parse trades
- calculate positions and PnL per trader/book/strategy
- produce custom reports
In [10]:
trades
Out[10]:
In [11]:
from btglib.utils import parse_traded_product

schedules = [parse_traded_product(p, m, datetime.now(), v) for p,m,v in trades[['Product','Market','Volume']].values]
position = pd.concat(schedules, axis=1).sum(axis=1)
position.plot();

ETRM
- trade processing with
re - positions generation/aggregation with
pandas - reporting with
reportlab - interface with Excel using
pyxll
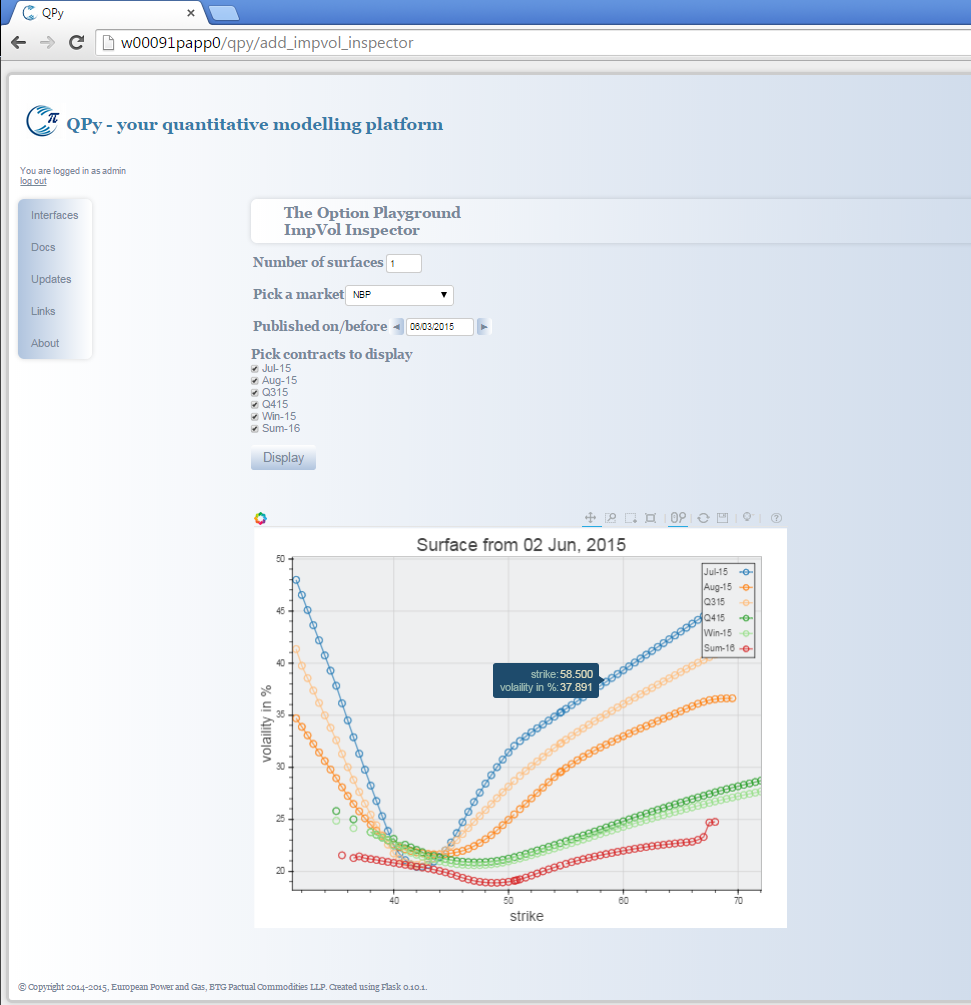
All of these require an implied volatility surface
In [12]:
from IPython.display import HTML
HTML('<iframe src=http://data.theice.com/MyAccount/Login.aspx?ReturnUrl=~\ViewData\Default.aspx width=1060 height=550></iframe>')
Out[12]:
Web-scraping with Python
requestsfor simple web pagesseleniumwhen we need to drive a web browser to navigate to the data- portable software testing framework for web applications
- compatible with most modern browsers
- bindings for a number of popular programming languages, including Python (and some others like Java, C#, Groovy, Perl, PHP and Ruby)
BeautifulSoupto parse the data
In [13]:
from IPython.display import HTML
HTML('<iframe src=https://plot.ly/~tbaeva/98/vol-surface-25-feb-2015/ width=960 height=700></iframe>')
Out[13]:
Automation, reporting, alerting
- python is great for automating tasks to scrape data, process and produce model results
- ...but also to produce and send out custom reports
- reports can be built with
reportlaband saved as pdf - emailing is easy with
smtplib
Automation, reporting, alerting
- reading your Outlook to automatically process data (e.g. from brokers)
In [14]:
import win32com.client

outlook = win32com.client.Dispatch("Outlook.Application").GetNamespace("MAPI")
inbox = outlook.GetDefaultFolder(6)
last_message = inbox.Items.GetLast()
print last_message.sender()
print last_message.subject
Deploying models to the desk
- traders love Excel
- python modules can be used from Excel, e.g. via
pyxll(Tony Roberts) - easy to centralise application modules and keep them under version control
- however...
- requires python installation on trader's machine
- package updates locally
- ...and traders don't like rebooting
Deploying models to the desk
- web interface
- models are triggered from the browser
- models run on a server
- results displayed on browser
- model runs can be logged
- easy to embed interactive plotting!
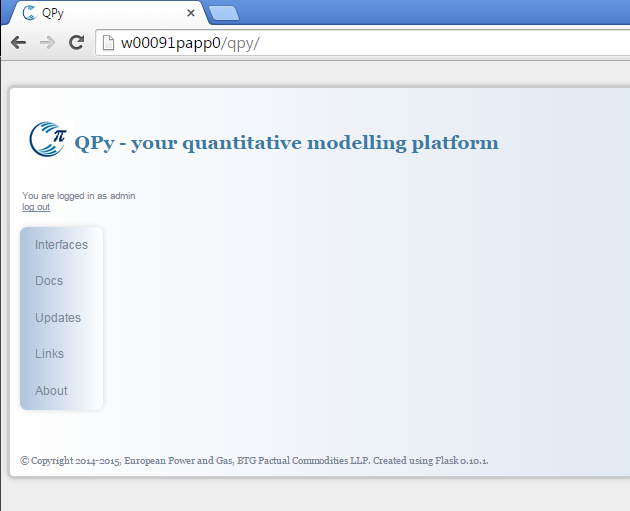
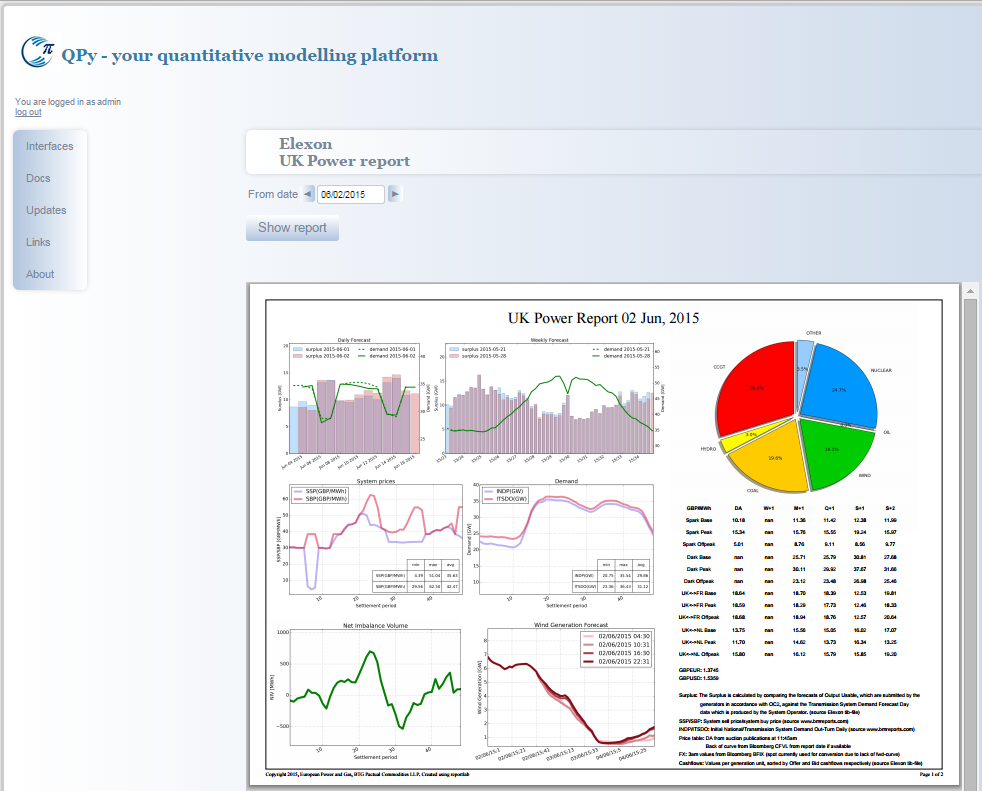
Web Interface
- built using
flaskandjinja - allows to have interface, documentation, wiki etc in one place
- running via Apache
In conclusion
- python is traditionally seen as a scientific language (scientific libraries)
- due to python's versatility and rich ecosystem it can be used to build a trading business from scratch
- full suite from data collection, to modelling, to visualisation, to automation, reporting and alerting, to great user interfaces
thanks!